

Trace View 5.0.0+
Trace view records the steps of a browser test, such as actions, assertions, and marks, together with DOM snapshots of the page. You can replay them in Vitest's trace viewer after the browser has moved on, so you can see what the page looked like when a step ran or failed.
By default, Vitest records only failed tests. Each failure prints its steps in the terminal and keeps a snapshot of the page when the test failed, which you can open in the trace viewer.
TIP
For Playwright's own .trace.zip traces, see Playwright Traces.
Failure Output
When a test fails, the error in the terminal is followed by a timeline of its recorded steps:
 FAIL src/sign-in.test.ts > signs in
Error: expect(element).toHaveTextContent()

Expected element to have text content:
  Welcome
Received:
  Sign in

 ❯ src/sign-in.test.ts:11:51
      9|   })
     10|   await page.getByRole('button', { name: 'Sign in' }).click()
     11|   await expect.element(page.getByRole('heading')).toHaveTextContent('Welcome')
       |                                                   ^
     12| })

Caused by: Error: Matcher did not succeed in time.

Trace:
  step                       locator                                   start  duration  location
  fill form                  -                                          +1ms      58ms  src/sign-in.test.ts:6:14
  ├── fill                   getByLabel('Email')                        +2ms      31ms  src/sign-in.test.ts:7:40
  └── fill                   getByLabel('Password')                    +34ms      24ms  src/sign-in.test.ts:8:43
  click                      getByRole('button', { name: 'Sign in' })  +61ms      18ms  src/sign-in.test.ts:10:55
  toHaveTextContent [ERROR]  getByRole('heading')                      +80ms    1003ms  src/sign-in.test.ts:11:16
These are the last 10 steps the trace viewer lists, without DOM snapshots. To see every step and the page when the test failed, open the trace in one of the places listed in Opening Traces.
Opening Traces
The trace viewer is available in three places:
- The browser UI shows the trace viewer next to the live view. The live iframe only shows the current page, so a trace is how you look at a test that has already finished.
- Vitest UI shows the trace viewer in the test's report.
- The HTML reporter includes the trace viewer in the generated report, which suits run mode and CI. With the HTML reporter enabled, the Vitest VS Code extension adds an Open Trace View action to tests in the Testing view and editor gutter.
Common setups look like this. The local setups pass --browser.traceView to record every test, since you usually want to inspect passing tests too while developing.
| Goal | Command | Result |
|---|---|---|
| Debug in the normal local browser UI | vitest --browser.traceView | The browser UI shows the trace viewer next to the live view. |
| Debug with a headless browser | vitest --browser.traceView --browser.headless --ui | The browser runs headless, and Vitest UI shows the traces. |
| Debug with a visible browser window and Vitest UI | vitest --browser.traceView --browser.headless=false --browser.ui=false --ui | Tests run in a separate headed browser window, and Vitest UI shows the traces. |
| Read failures in CI logs or from a coding agent | vitest run | The terminal shows the timeline of each failure. |
| Inspect failures in CI or run mode | vitest run --reporter=html | The HTML report shows each failure's steps and the page when it failed. |
Trace Viewer
The viewer has two resizable panes:
- Step list (left) shows every recorded action, assertion, mark, and lifecycle entry, with its name, timing, selector, and source location. Failed actions and assertions are highlighted in red.
- DOM snapshot (right) shows the page at the selected step, with the interacted element highlighted in blue. When only failed tests are recorded, the snapshot is taken at the end of the test.
Selecting a step also opens its source location in the Editor tab when that location is available.
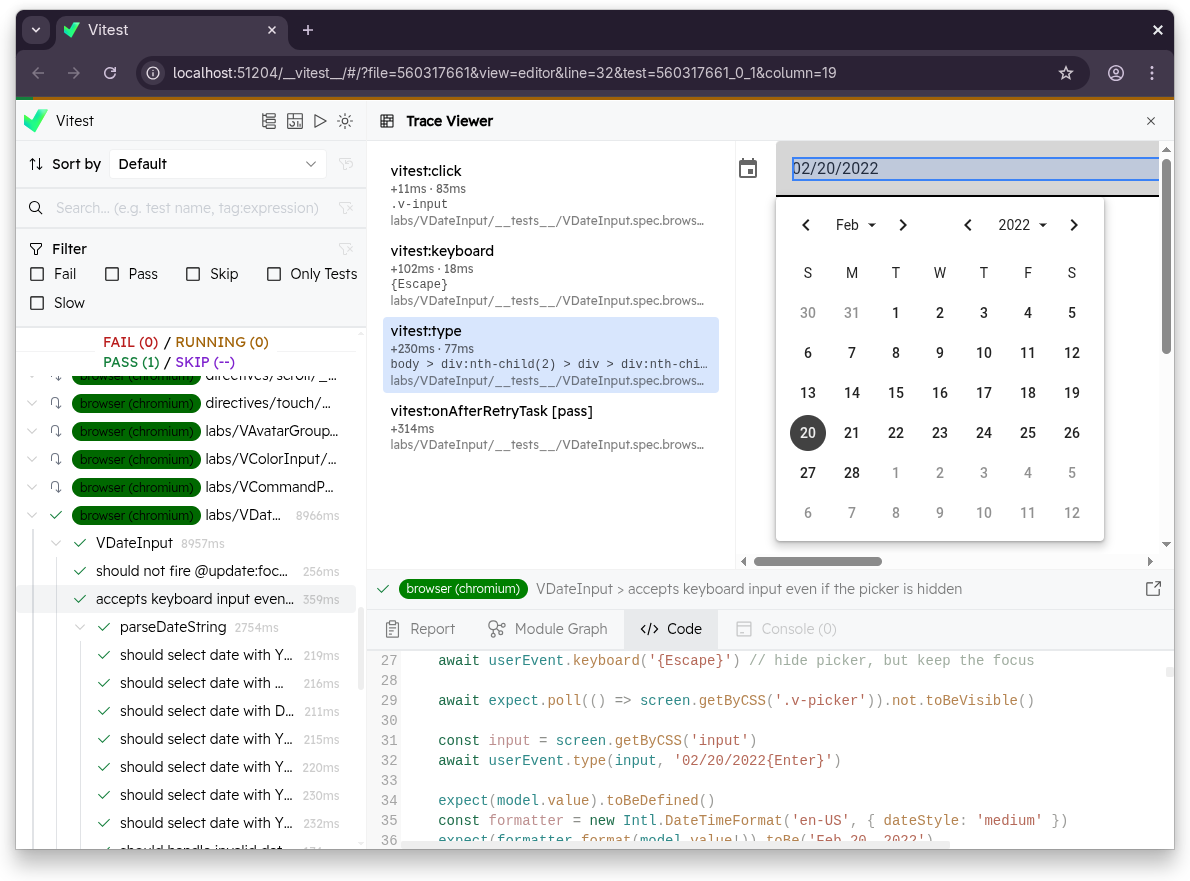
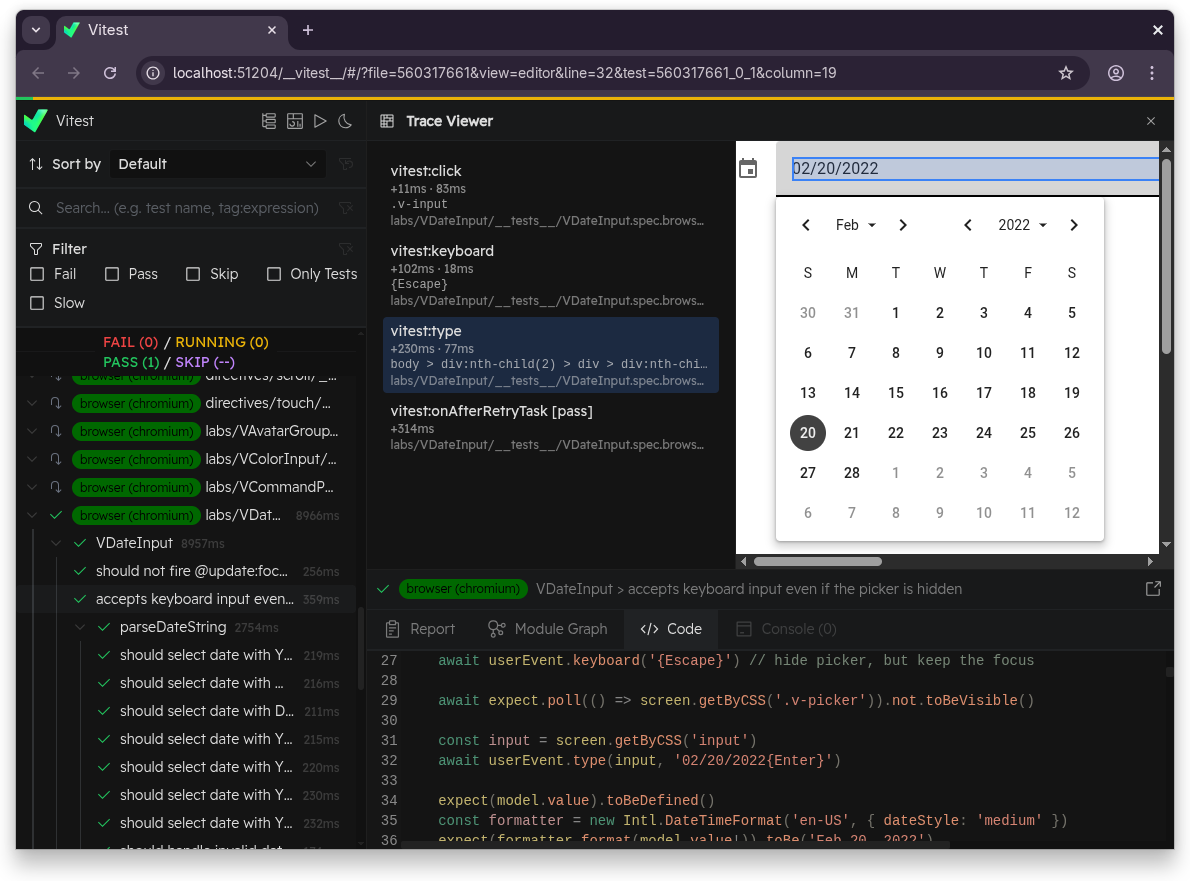
Example replay uses Vuetify's VDateInput component.
Recording Every Test
To record passing tests too, with a snapshot at every step, set browser.traceView to true:
import { defineConfig } from 'vitest/config'

export default defineConfig({
  test: {
    browser: {
      traceView: true,
    },
  },
})vitest --browser.traceViewIn this mode, Vitest UI also streams steps as the test runs, so you can inspect them before the test finishes. Long-running actions, expect.element(...) assertions, and callback page.mark() entries first appear as in-progress steps, then update with their final status and duration.
Set browser.traceView to false to turn trace view off.
Recorded Steps
Vitest records a step for:
expect.element(...)assertions- Interactive actions such as
click,dblClick,tripleClick,fill,clear,type,hover,selectOptions,upload,dragAndDrop,tab,keyboard,wheel, and screenshots - Test runner lifecycle events, such as
vitest:onAfterRetryTaskafter each test and retry run
Each step records its timing, selector, and the source location that triggered it.
Custom Trace Entries
You can insert your own named entries with page.mark() and locator.mark():
import { page } from 'vitest/browser'

await page.mark('content rendered')

await page.getByRole('button', { name: 'Sign in' }).mark('sign in button')
You can also pass a callback to page.mark() to group steps. The mark entry spans the callback, and the actions inside it are nested under the mark in the step list:
await page.mark('sign in flow', async () => {
  await page.getByRole('textbox', { name: 'Email' }).fill('john@example.com')
  await page.getByRole('textbox', { name: 'Password' }).fill('secret')
  await page.getByRole('button', { name: 'Sign in' }).click()
})
Use vi.defineHelper() to make entries from reusable helpers point to the call site rather than the helper's internals:
import { vi } from 'vitest'
import { page } from 'vitest/browser'

const renderContent = vi.defineHelper(async (html: string) => {
  document.body.innerHTML = html
  await page.elementLocator(document.body).mark('render')
})

test('shows button', async () => {
  await renderContent('<button>Hello</button>') // trace entry points here
})
Retries and Repeats
Each retry or repeat of a test is recorded as a separate trace. The viewer opens the most recent attempt, and you can switch between attempts in the Report tab.
Accessibility Tree 5.1.0+
Trace view also captures the page's accessibility tree with each snapshot. The view selector in the trace viewer header switches the snapshot pane between DOM and Aria. The Aria view lists the roles, accessible names, and states that role-based locators such as getByRole() see, in the same format as aria snapshots. Set traceView.ariaSnapshot to false to disable it.
Snapshot Fidelity
A snapshot captures the DOM tree, attributes, form values, same-origin readable CSS, element scroll positions, viewport size, and window scroll position. Images and canvas pixels are not inlined.
Stylesheets are captured through the browser's CSSOM. Readable <style> tags and same-origin <link rel="stylesheet"> files are serialized into the snapshot and replayed as inline styles, so component styles keep working in the trace viewer and HTML report. Because this captures the parsed rules the browser applied rather than the original stylesheet files, comments, formatting, invalid rules, and files referenced from CSS, such as background images and fonts, are not included.
Two options capture more of the page:
import { defineConfig } from 'vitest/config'

export default defineConfig({
  test: {
    browser: {
      traceView: {
        inlineImages: true,
        recordCanvas: true,
      },
    },
  },
})
inlineImages stores the pixels of loaded <img> elements in the snapshot, so the HTML report renders them without depending on the original URLs. It captures pixels rather than the original files, which means SVGs are rasterized and animated images become still. Cross-origin images are inlined only when their pixels are CORS-readable. Otherwise they still render from their URL while it stays reachable.
recordCanvas stores readable canvas pixels in the snapshot. This works for charts and simple 2D canvas output, but it does not record canvas drawing over time or replay WebGL.
Canvas replay sandbox
rrweb redraws canvas data through an image load handler, so the trace viewer allows scripts inside its replay iframe for traces recorded with recordCanvas. Enable this option only when canvas pixels help with debugging.
External Resource Limits
Trace view has no resource store, so anything that is not captured into the snapshot still loads from its original URL. This includes CSS background images, @font-face files, videos, and images that inlineImages could not capture. They render in the viewer while the URL is reachable, but an HTML report opened elsewhere may show them missing.
Relation to Playwright Traces
browser.traceView and browser.trace are independent features, and you can enable both at the same time:
browser.traceView | browser.trace | |
|---|---|---|
| Provider support | All providers (playwright, webdriverio, preview) | Playwright only |
| Viewer | Browser UI / Vitest UI / HTML reporter | Playwright Trace Viewer / trace.playwright.dev |
| Format | rrweb DOM snapshots | Playwright .trace.zip |
| Requires external tool | No | Yes (npx playwright show-trace) |
See Playwright Traces for the browser.trace workflow.